20200511M Santa Cruz, CA: On the 27th of December, I attended my cousin’s wedding in Texas. I didn’t realize that wedding ceremonies like this would be a rarity in 2020.
San Antonio Botanical Garden, Dec. 27, 2019 (Credit: SurfingTheUniverse.com)
The stock market also hit a high for the year on this date. I found this article and headline by Ben Levisohn of barrons.com to be appropriate looking back:
The market will probably have a hard time living up to 2019. The Dow Jones Industrial Average has risen 23% in 2019 after gaining 190.17 points, or 0.7%, to 28,645.26, this past week, while the S&P 500 index has gained 29% after rising 0.6%, to 3240.02, and the Nasdaq Composite has climbed 36% after finishing the week up 0.9%, at 9006.62. The S&P 500 and the Dow both closed the week at all-time highs.
For reference, today – May 11th – the DOW closed at 24,221.99, the S&P 500 index closed at 2930.19, and the Nasdaq closed at 9192.34.
As the market attempts to perform a V recovery as Trump wishes, these final thoughts of this article are worth noting:
All that’s missing is what could go wrong. We have a few things: The trade war between the U.S. and China could heat up again. Europe could become President Donald Trump’s next trade target. Inflation could heat up and cause the Fed to start thinking about raising rates again. And the economic acceleration the market appears to be expecting might simply fail to show up.
Everyone else may be looking at the bright side. We have our doubts.
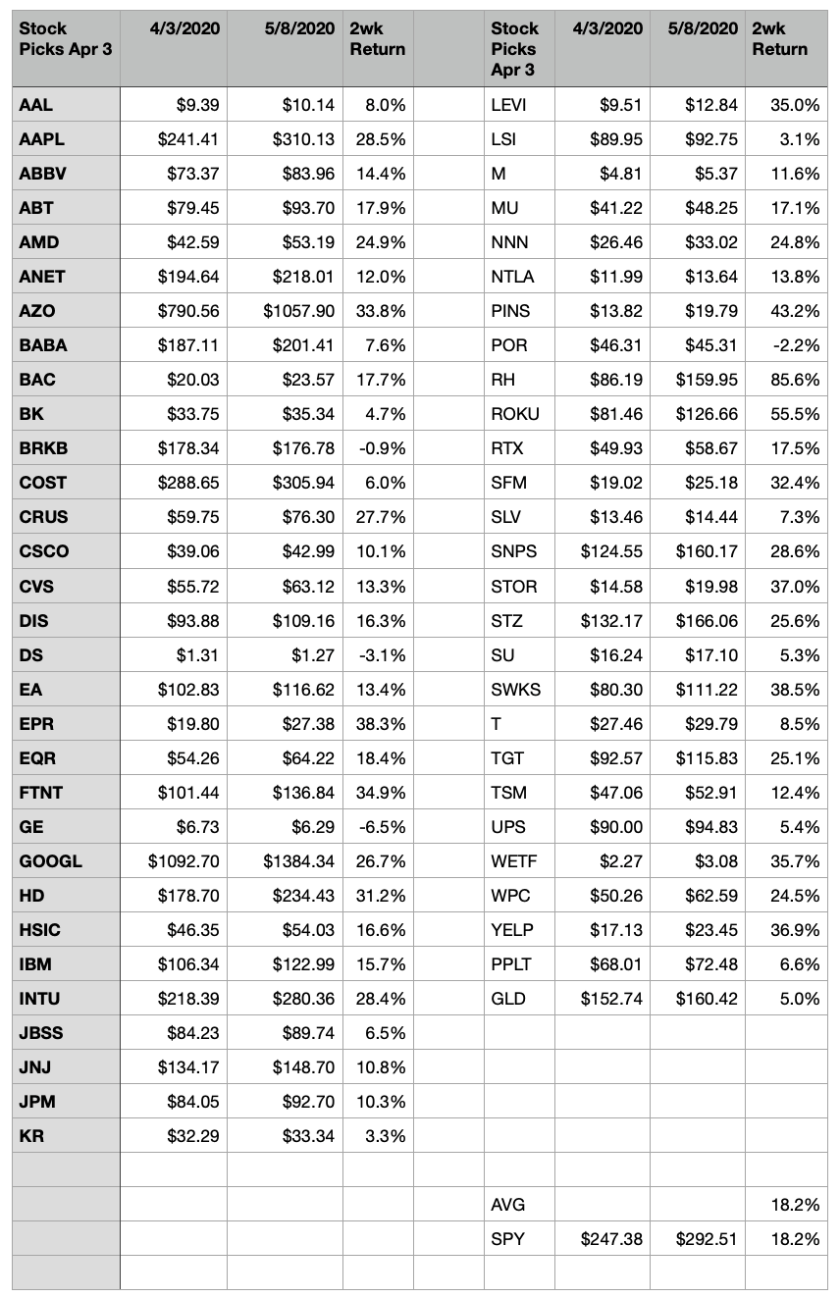
I am a bit surprised that these long picks so closely matched the SPY. With 500 stocks, the SPY provides better diversification. I prefer to be a bit more conscious of the stocks I am picking and don’t want to blindly invest in an index.
For some reason, I started looking at the current price of the S&P 500 of $2929.80 and looked back to when it was about this price in the past. On Oct 4, 2019, S&P 500 closed at $2951.01. Much more synchronistically, the S&P 500 hit a local top of $2925.51 on Oct 3, 2018. Over the next 3 months from that date, the S&P 500 dropped 17% to $2447.89. The Oct 3, 2018 date is synchronistic to me because I referred back to it in AAPL Stock Prediction for Oct 3, 2019, in which I noted:
On Oct 3, 2018, AAPL hit an all time high of $233.47 and today it is down over 20% from that high, opening at $178.37. Could I surf to a universe where APPL stock is up over 25% from today by Oct 3, 2019? In that universe, AAPL would be above it’s all time high price of $233.47. While I can imagine how I could increase my odds of that universe, I do not feel a calling to do so due to the limited influence I believe I have on that event. So, I’m left with a sense based primarily on wishful thinking that AAPL stock will hit a new all time high before Oct 3, 2019.
The AAPL stock prediction was close. AAPL closed at $220.83 on Oct 3, 2019 and a week later set a new high of $236.21 on Oct 11, 2019. On Mar 20, 2020, AAPL hit a year low of $229.24.
If it’s synchronistic, then there must be some meaning to it. The meaning that I’m feeling is that the world is at an inflection point and something unexpected is about to happen.
Blue Rhino Natural Gas Dispenser at Santa Cruz CA Gas Station Broken Into – April 28, 2020
Even though gas prices at the pump are cheap, relatively speaking, there are still those for whom the price is not low enough. Propane tanks were stolen recently from a Blue Rhino gas dispenser. This event is closer to a universe where goods are scarce, such as a universe I blogged about yesterday in 20200427M Day 118: Who Is John Galt?, before filling my car up with gas today. It was interesting how I came to notice. I saw the Blue Rhino dispenser and, for some unknown reason, was drawn to go look at it even though there was no damage from the exterior and no real reason for me to go check it out. As I walked towards it, a guy with a mask on started whistling at me from outside the gas station. When I turned to notice him, he told me that the dispenser had been broken into. It was then that I decided to investigate it further and see how the back of the dispenser had been pried off.
A few days ago I was moved to take a picture of a man blowing bubbles along West Cliff (20200423h Day 114: Bubbles in the Air). I wonder now if the US dollar is in a bubble. The value of the US dollar has remained strong, relative to other currencies, and has even held up fairly well against the price of gold. Investigating some ratios involving oil, gas, and the US dollar will help us understand the universes around us.
Figure 1: Barrels of Oil that can be purchased with a $50 American Gold Eagle (1 oz gold) – Courtesy macrotrends.net
In Figure 1, the recent drop in the price of oil due to the supply/demand imbalance can be easily seen, even when priced in ounces of gold. Apparently, the demand for gold has not dropped, or at least not dropped more than the supply of gold.
Figure 2: S&P500 value when priced in $50 American Gold Eagles (1 oz Gold) – Courtesy macrotrends.com
In Figure 2, it’s interesting to see how much of the S&P500 increase in value is over the long term is actually due to the decrease in the value of the measuring stick – the US Dollar. When the S&P500 is measured in the closest thing we have to a gold-backed currency, $50 American Gold Eagles, then a more real evaluation of the value of the S&P500 over time can be seen.
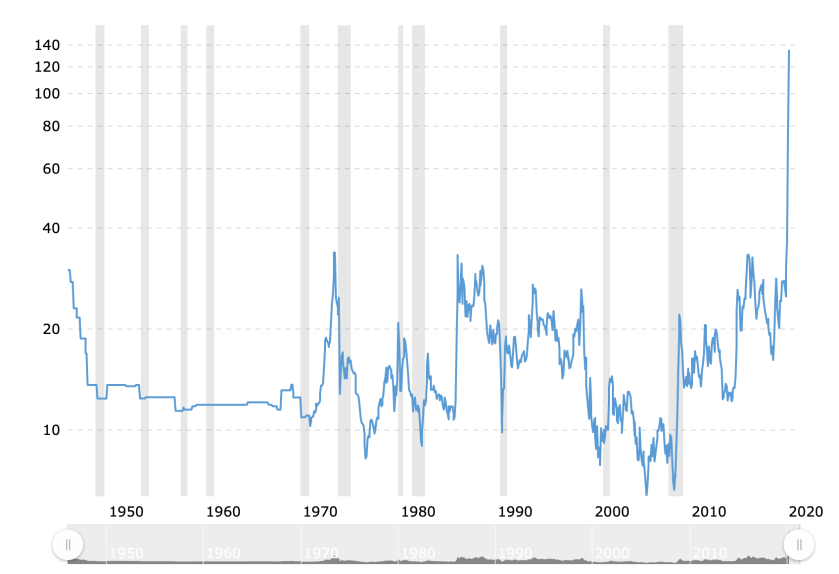
Figure 3: Gold/Silver Ratio since 1915 – The rough number of $1 American Silver Eagles (1 Oz Silver) you can exchange for a $50 American Gold Eagle (1 Oz Gold). Notice how the ratio deviates between half and double the par value of 50. Courtesy macrotrends.net
Figure 3 is evidence for why I am currently long Silver. I primarily purchase Silver through the ETF $SLV because I can purchase using my retirement account and quickly move in and out of a position without worrying about loading up a truck.
Figure 4 is interesting because it values the price of gold in inflation-adjusted dollars. This, of course, hides the depreciation of the US dollar. If CPI is to be believed as an accurate measure of this depreciation, then gold appears to be over-valued at this point. I think it is more likely that the CPI is lower than the actually inflation rate. The way CPI was calculated was changed in 1980. If CPI were still calculated in the same way, it would be higher (see Figure 5).
Demand for oil will increase as the world economy comes back online. This will cause the value of oil to return to it’s pre-pandemic value;
The Fed will continue to prop up the bond market, including mortgages and corporate bonds, thereby preventing a deflationary implosion that would result otherwise;
The “free money” that businesses and people receive through unemployment and stimulus checks will also prevent deflation from spiraling out of control;
The supply/demand ratios for goods and services will both decrease and, once the economy is back, this will cause an increase in prices; and
The Fed will hesitate to raise interest rates too fast and this will result in cheap money flooding the financial system, which will encourage what will look like speculation in the financial and housing markets.
In the longer term, there is a measurable probability that real inflation will finally get above 2% and possibly even get out of control. This definitely happens in some nearby universes – just not sure now how prevalent these universes are.
I’d like to end with some quotes from fellow wordpress.com bloggers:
Regular readers will be aware that a feature of my work is to look at the impact of inflation on the ordinary worker and consumer as opposed to central bankers who love to torture the numbers to get the answer they wanted all along
I had thought that given the neighborhood the house, despite its small size, would sell for about $400,000. That would be a sizable increase from the price it sold for 60 years ago. I was wrong though. Asking price is $599,900, 50 times what my parents paid for it. No wonder my mother and I were a bit discombobulated.
A grand inflation in front of a depression is pretty much the end of an economy. If the government prints money in serious quantities and issues debt in more or less unlimited quantities the game is over. The gold bugs will have won.
A rather smart investor named Rick Rule once said, “We don’t want to live in a world with $10,000 an ounce gold.”
Right now there is a greater than zero chance that this will be exactly the world we live in.
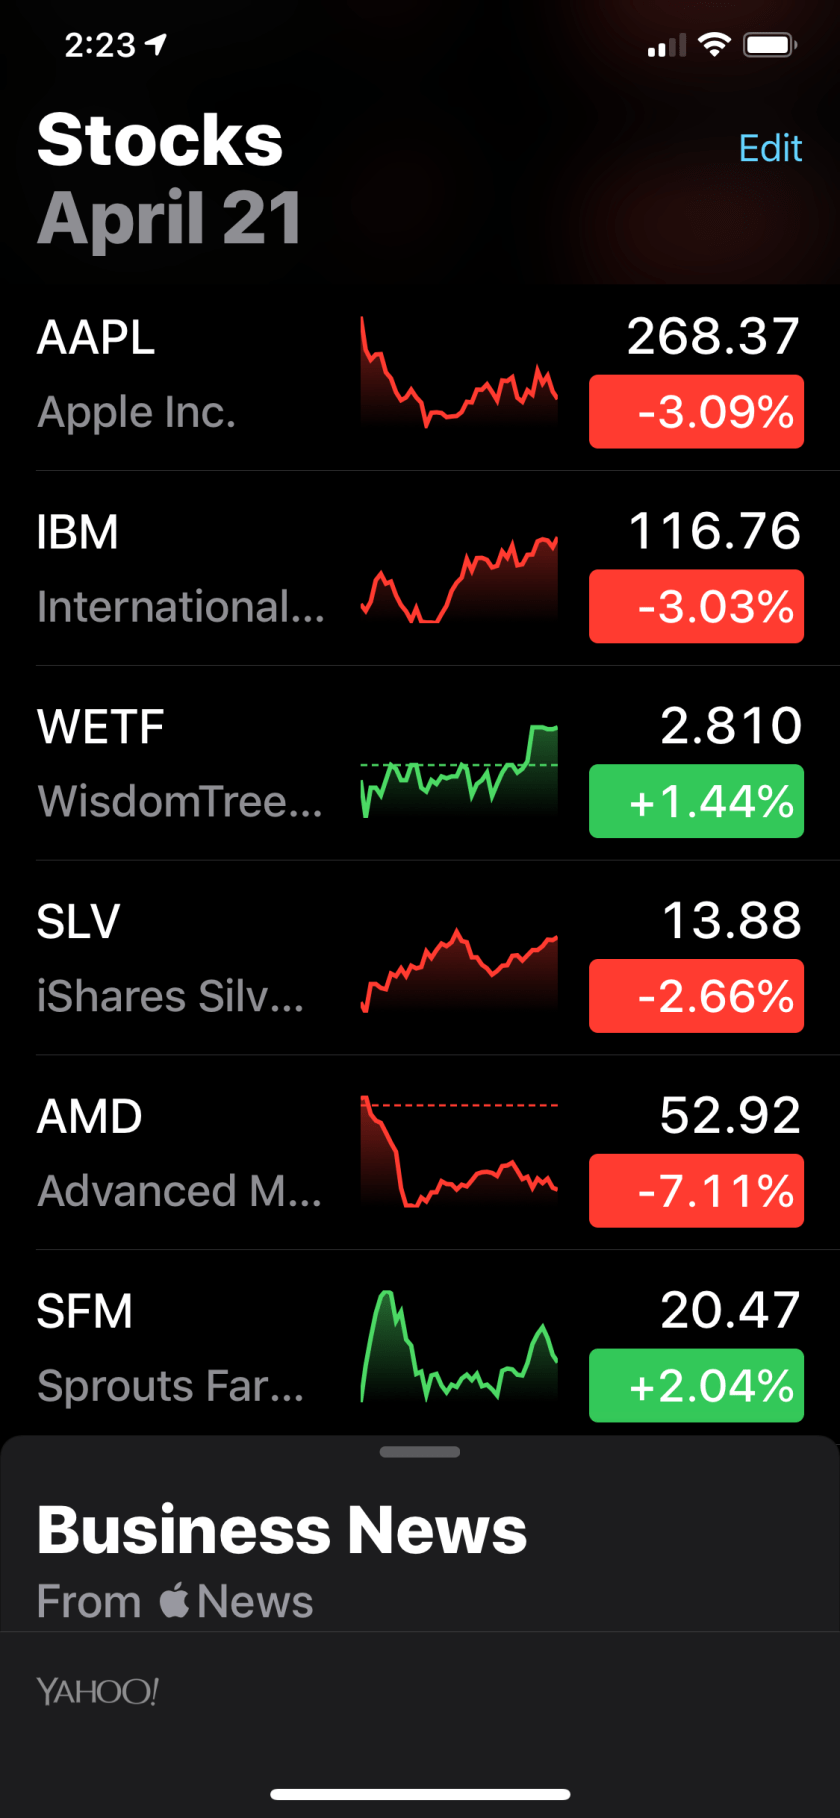
The stock market is still quite volatile, as evidenced by the daily movement in my top 6 stock picks: AAPL, IBM, WETF, SLV, AMD, and SFM. This is definitely not as diversified a list as I would like, with 3 technology companies in the mix. However, it is much better than it was 6 months ago when it was all in AAPL and AMD at about a 75%/25% mix. In December and January, I sold some AAPL and AMD and waited for the coronavirus crash before buying or adding to positions in IBM, WETF, SLV, and SFM. My mix is now 44%/20%/14%/11%/6%/5%. From a diversification point of view, I feel much better. My average price for these stocks are $1.23, $109.20, $3.50, $14.25, $10.00, and $16.48.
I would like to be in a universe in which there is an app, program, or website that will give me a summary financial report of my stock holdings. As a website, I would send up some JSON such as:
and get back a combined set of financial parameters such as P/E, Cash Flow, Market Cap, etc. Mutual funds, especially a commodity fund like SLV, would likely need to be ignored.
Santa Cruz, CA: Last week the stock market had a good week – one of the best in quite a while. A few days ago I spoke to a friend from the future who is betting against the market. She is not alone. I just googled “hedge fund bets on sell off” and found the following – interesting from Nov. 22, 2019!
Ray Dalio replied to the WSJ by posting that it is misleading to report that he had a bearish view of the stock market and that his hedge fund, Bridgewater Associates, had no “net bet” that the stock market would fall. What seems clear is that he was hedging his stock portfolio to protect it from a drop in the overall market.
So, Ray was apparently feeling the recent market plunge back in October of last year and started buying “insurance” against a total market correction. It would require delving into conspiracy theories to ponder the reasons why he felt the need for such insurance. Perhaps he took notice of the Event 201 Pandemic Simulation Exercise. From the website:
Event 201, hosted by the Johns Hopkins Center for Health Security, envisions a fast-spreading coronavirus with a devastating impact
In an article from almost a month ago, Bridgewater has placed even bigger bets – $15B against Europe and UK. From the article:
The world’s biggest hedge fund manager’s short positions amount to more than $5.3 billion in France and $4.7 billion in Germany, while in Spain its shorts add up to almost $1.4 billion and $821 million in three Italian companies.
…
Data was not available to show whether Bridgewater, which has $160 billion in assets under management, holds more European stocks than it shorts.
Another hedge fund manager, Bill Ackman, posted about a 100x return on his company’s website:
On 23 March, we completed the exit of our hedges generating proceeds of $2.6bn for the Pershing Square funds, compared with premiums paid and commissions totaling $27m.
I’m sure if I searched I could find other examples of huge bets against the market. Given the fear caused by the pandemic, and the obvious negative effect it is going to cause on the world economies, a bet on the market failing seems like a safe one. However, my thought is that any bet on a failing market should be truly a hedge in this time of uncertainty and act to cushion the loss in value of a net long position. By being long on solid companies and adding a hedge against the entire market dropping, hedge fund managers should be able to sleep better at night.
My thoughts on where the stock market is going is all of the above. It will drop due to the increasing costs of the pandemic, it will rise due to the monetary and governmental stimulus, and it will stay the same due to the balance of these two. There are a set of universes for each of these three scenarios and I would like to plan so that my portfolio stays roughly the same in each of these cases. For bonds, I like floating over fixed, shorter over longer, and treasuries over non-treasuries. For real estate, I like residential over commercial. For equities, I like American over non-American – although the stronger dollar is going to be a weight on American companies. For currencies, I like the Dollar over the Euro and Yuan and the Yen over the Dollar. For precious metals, I like Silver over Gold. There is a high likelihood that one or more fiat currencies experiences hyper inflation and the Dollar is not immune.